
Redmine Dashboards
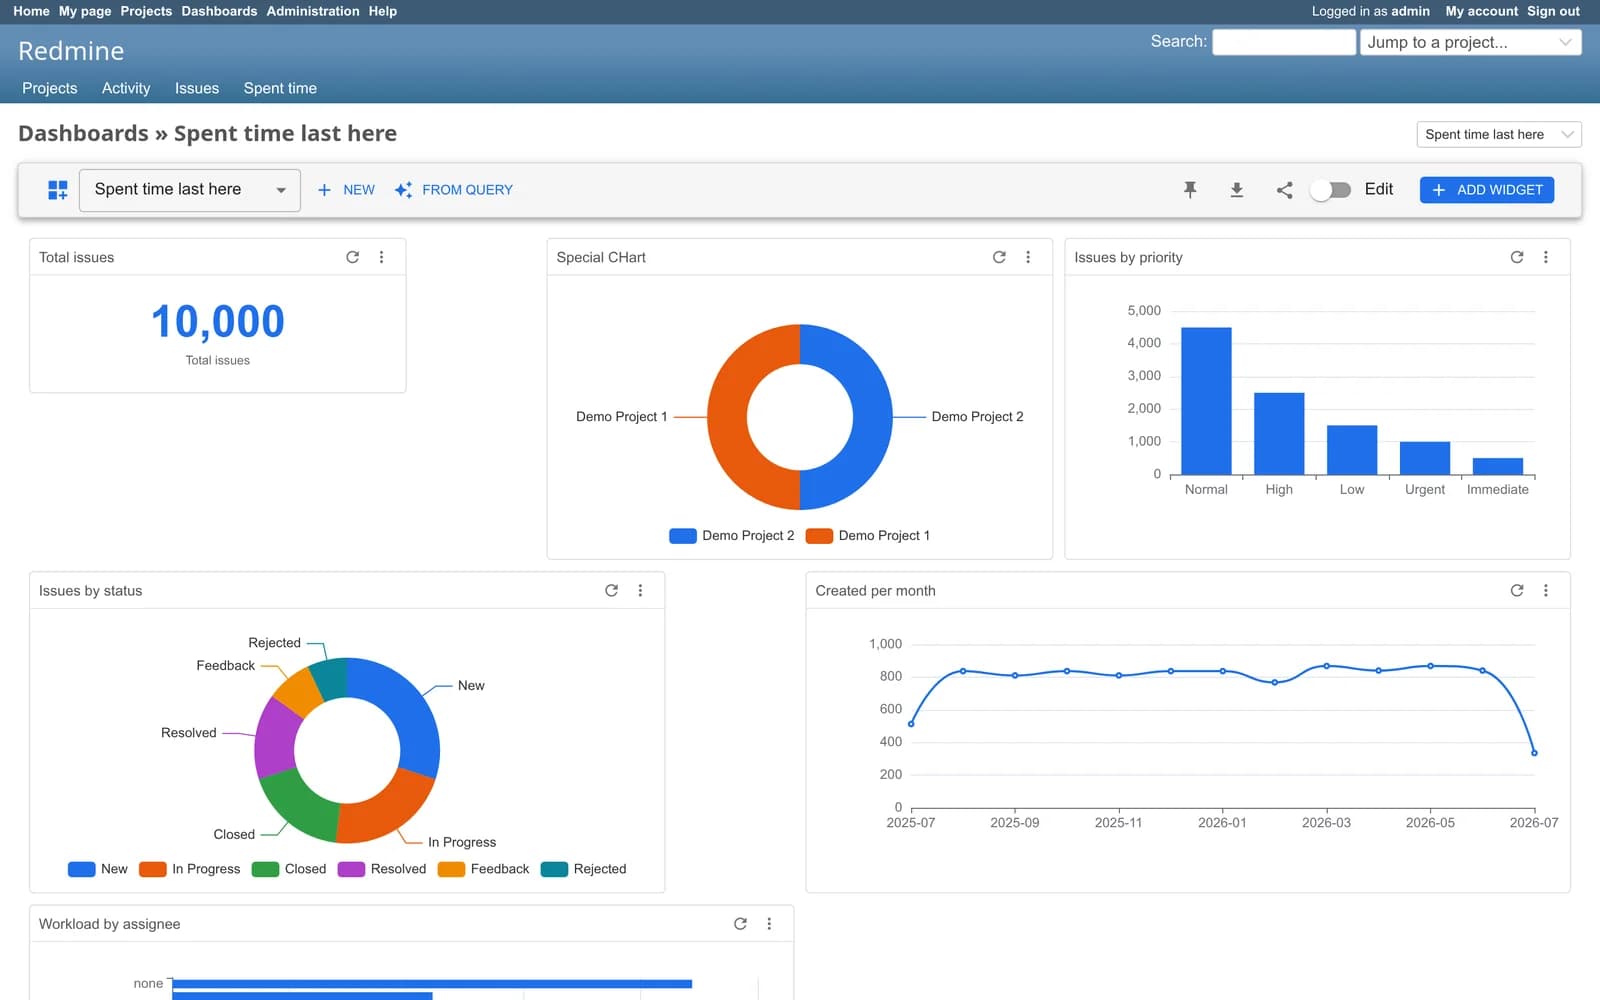
DashboardsDashboards built out of the saved queries you already have — a drag-and-drop grid of KPI tiles, tables and fifteen chart types, aggregated in SQL and scoped to whatever the person looking is allowed to see.
Multiple servers: $399
- Widget types
- 23
- Chart variants
- 15
- Redmine
- 4 · 5 · 6 · 7
- Databases
- MySQL, MariaDB, PostgreSQL
- Core patches
- None
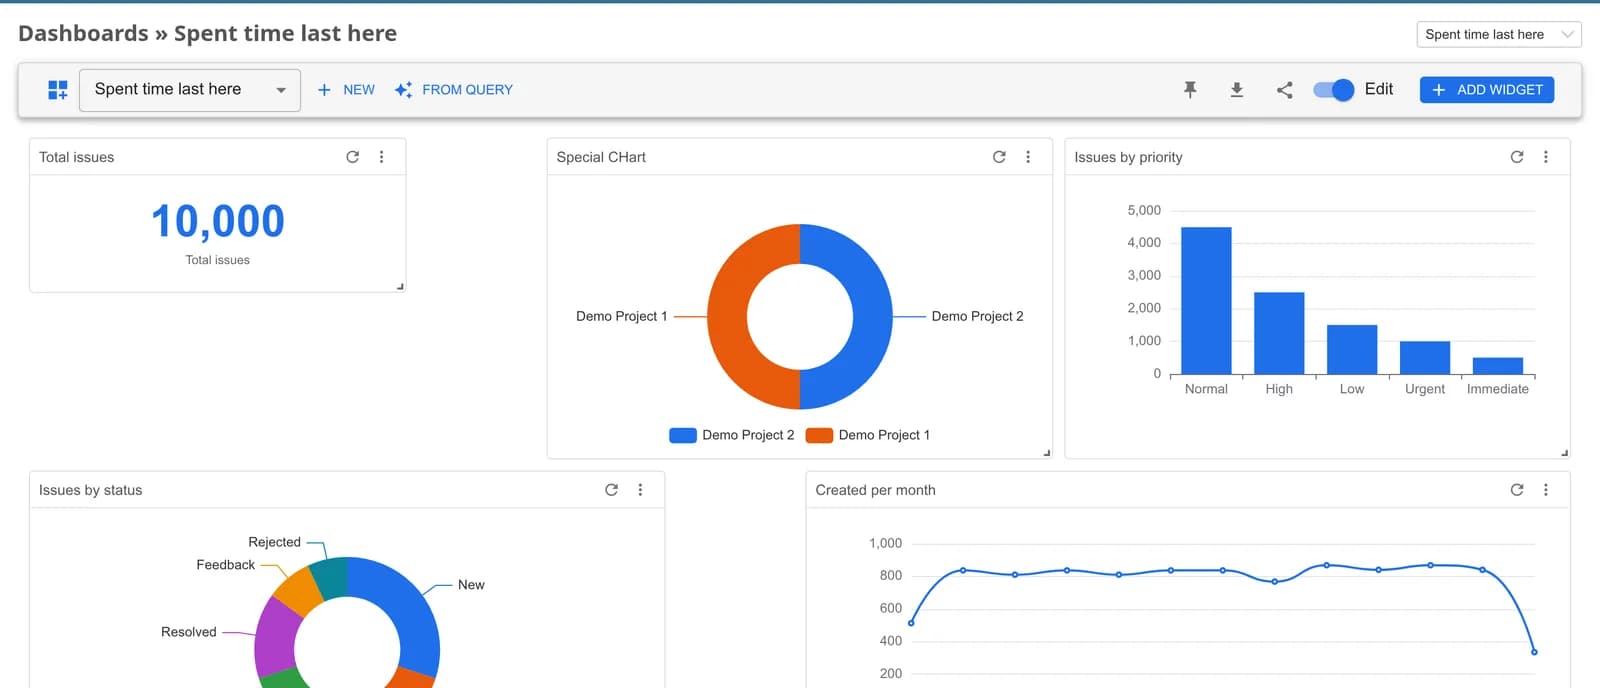
Drag-and-drop builder
A resizable, reorderable grid that saves itself as you work. Arrange KPIs, charts and tables until the board tells the story you need — no layout file, no page reload.
Fifteen chart types
Bar, horizontal, stacked, line, multi-line, area, pie, donut, radar, polar, gauge, funnel, heatmap, treemap and progress ring — drawn with Apache ECharts, in light and dark.
Your saved queries, visualised
Point a widget at a saved query and it inherits that filter — custom fields, watchers and sub-projects included. Or turn the query into a whole board in one click.
Aggregated in SQL
GROUP BY, COUNT, SUM and AVG run in the database, so a hundred thousand issues get counted rather than instantiated. Results cache per user, widget and active filters.
Scoped to the viewer
Every read starts from Issue.visible(user), TimeEntry.visible(user) and Query.visible(user), so no chart can total a project the person reading it is not a member of.
Filters, refresh and drill-down
One filter bar re-scopes the whole board, a per-dashboard interval keeps a wall display current, and every bar, slice and cell clicks through to the issue list behind it.
See it running inside Redmine
Every screenshot here comes from a stock Redmine 6 install with the plugin dropped into plugins/. The dashboards sit under Redmine’s own header and menus, because that’s where they run.
Build a board
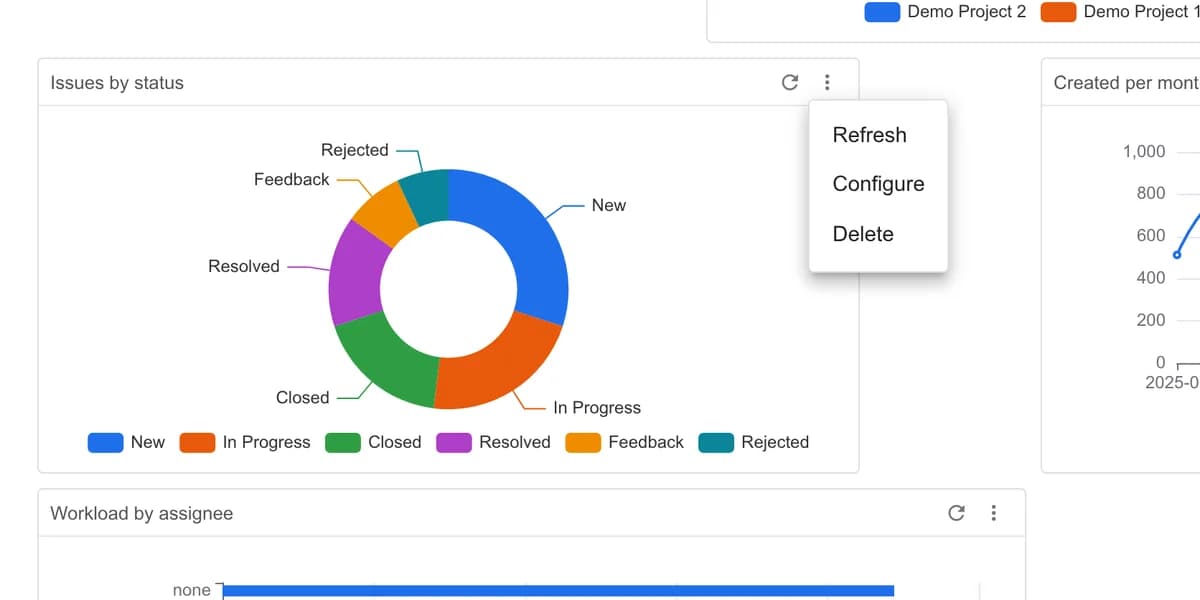
Widgets
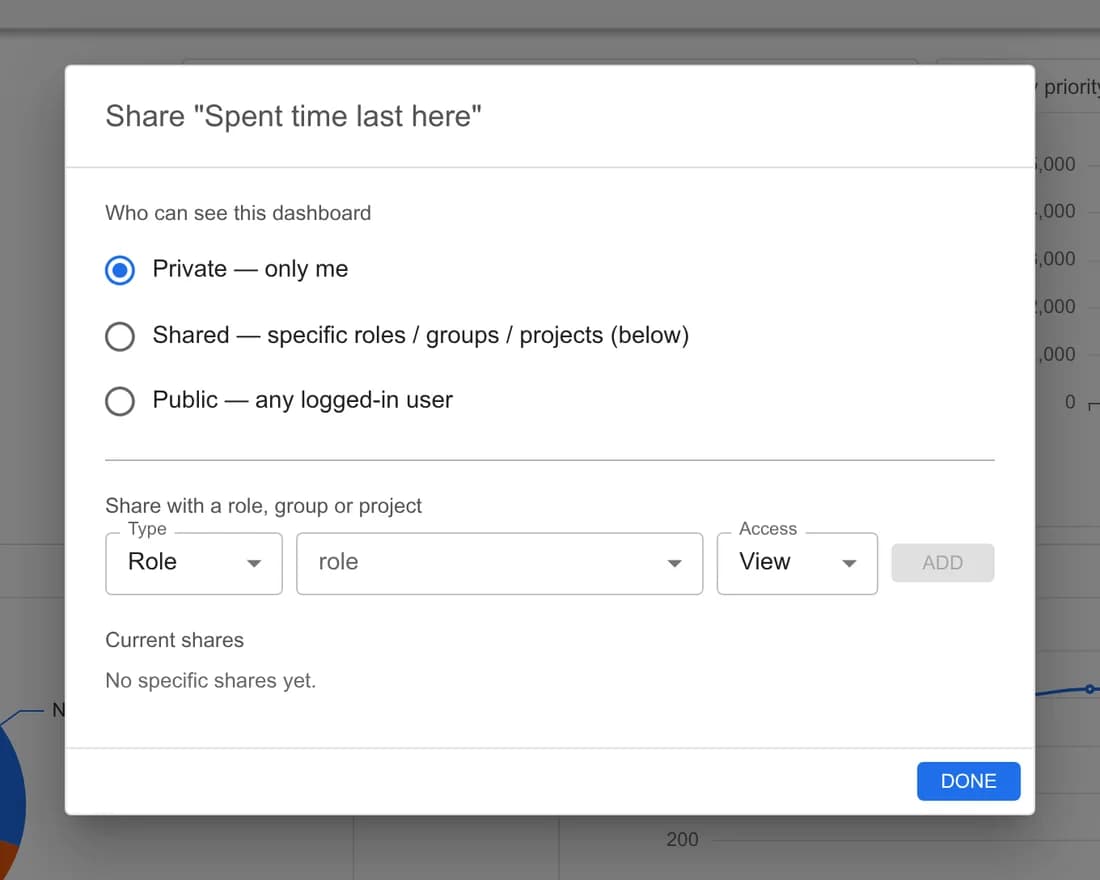
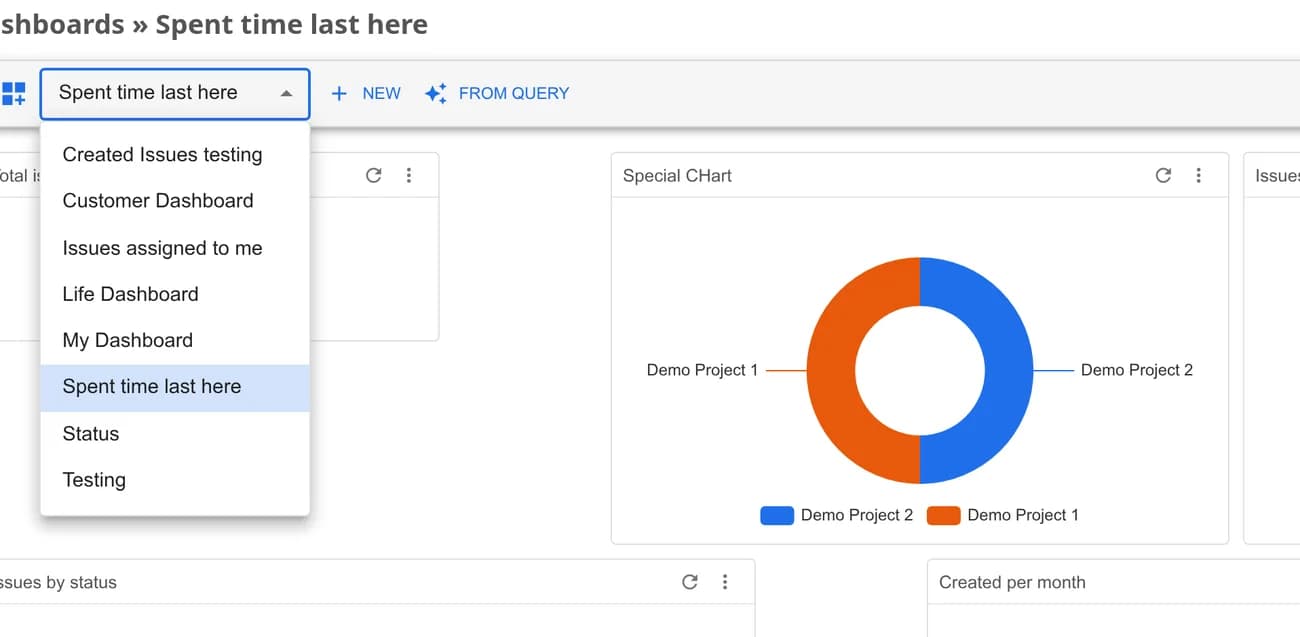
Share and switch
The query is already the report
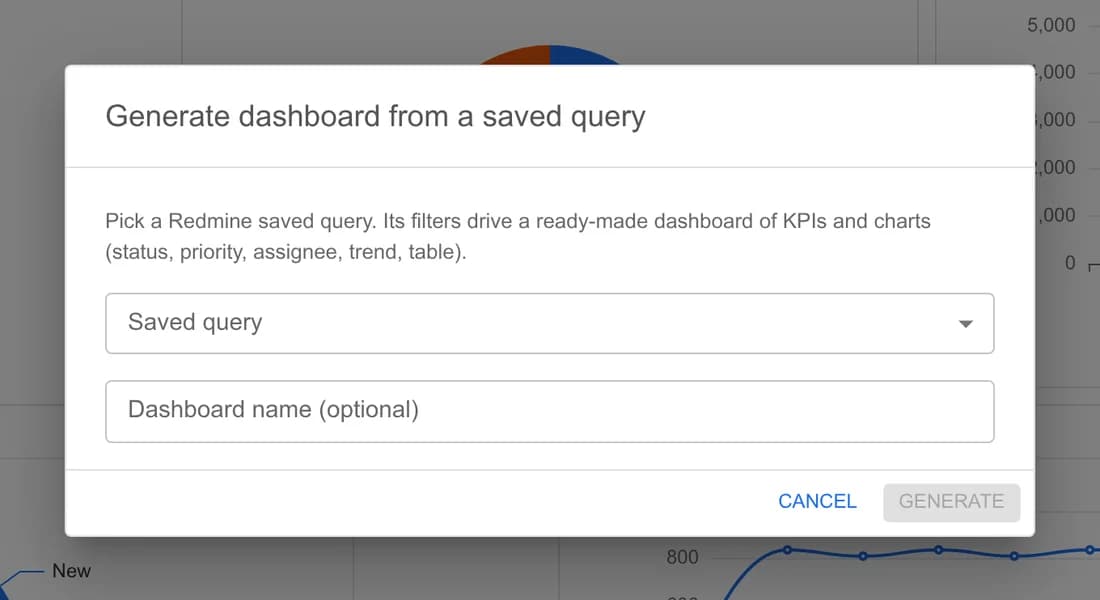
Nothing here asks you to describe your data a second time. Filter an issue list the way you always have, save it, and that saved query becomes the scope a widget aggregates — the same relation Redmine uses to render the list itself.
| Step | What you do | What you get |
|---|---|---|
| 1. Save a query | Filter the issue list — custom fields, watchers, sub-projects — and hit Save | A named query, shared with whoever you shared it with |
| 2. Point a widget at it | Pick that query in the widget dialog | Data source and a sensible default grouping, derived for you |
| 3. Or generate the whole board | Click From query | A dashboard of KPI tiles and charts bound to it, in one request |
Configured from dropdowns, not SQL
A widget is a source, a dimension, a measure and an aggregation. Group issues by status, priority, tracker, assignee or any date field bucketed into days, weeks, months or years; count them, sum estimated hours, or average the done ratio. Nobody on the team writes SQL to get a chart — and because there is no SQL to write, there is no query that can reach past the permissions of the person reading it.
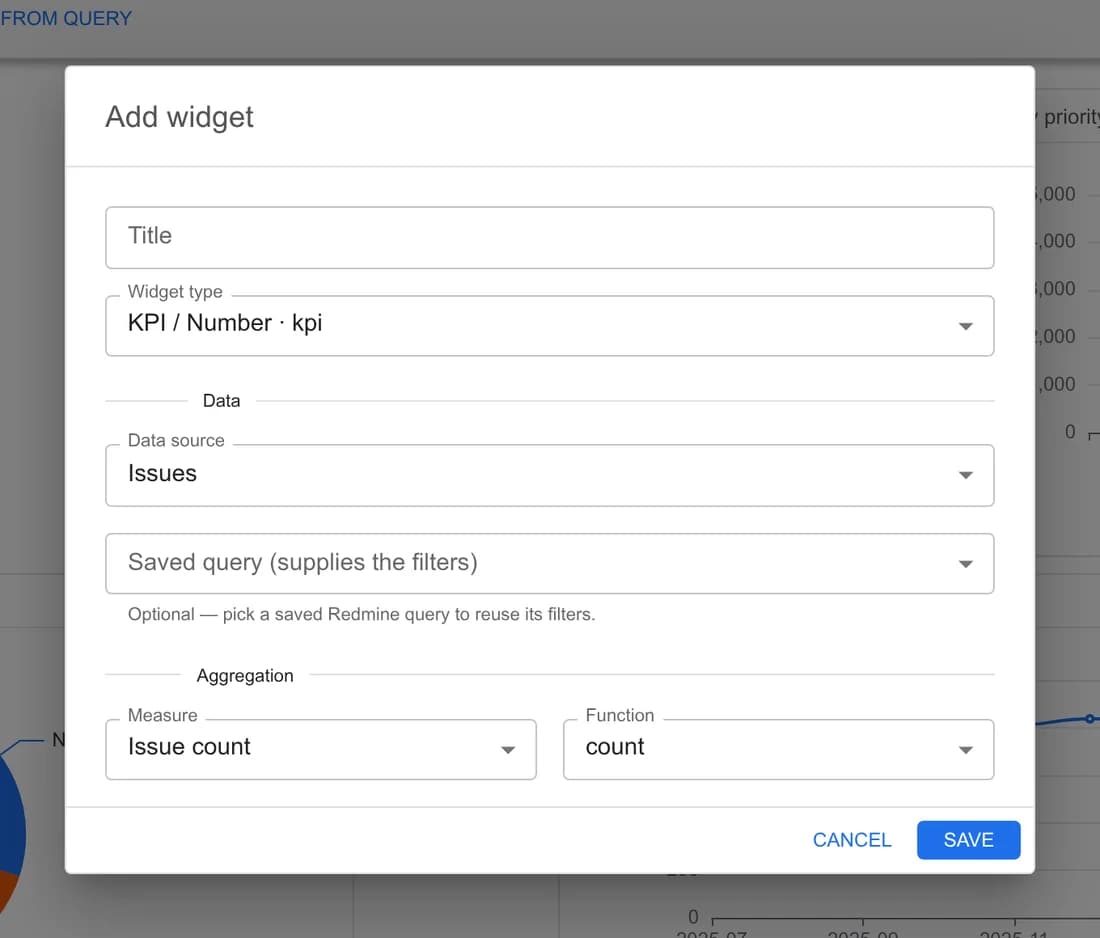
Configure every widget from one form
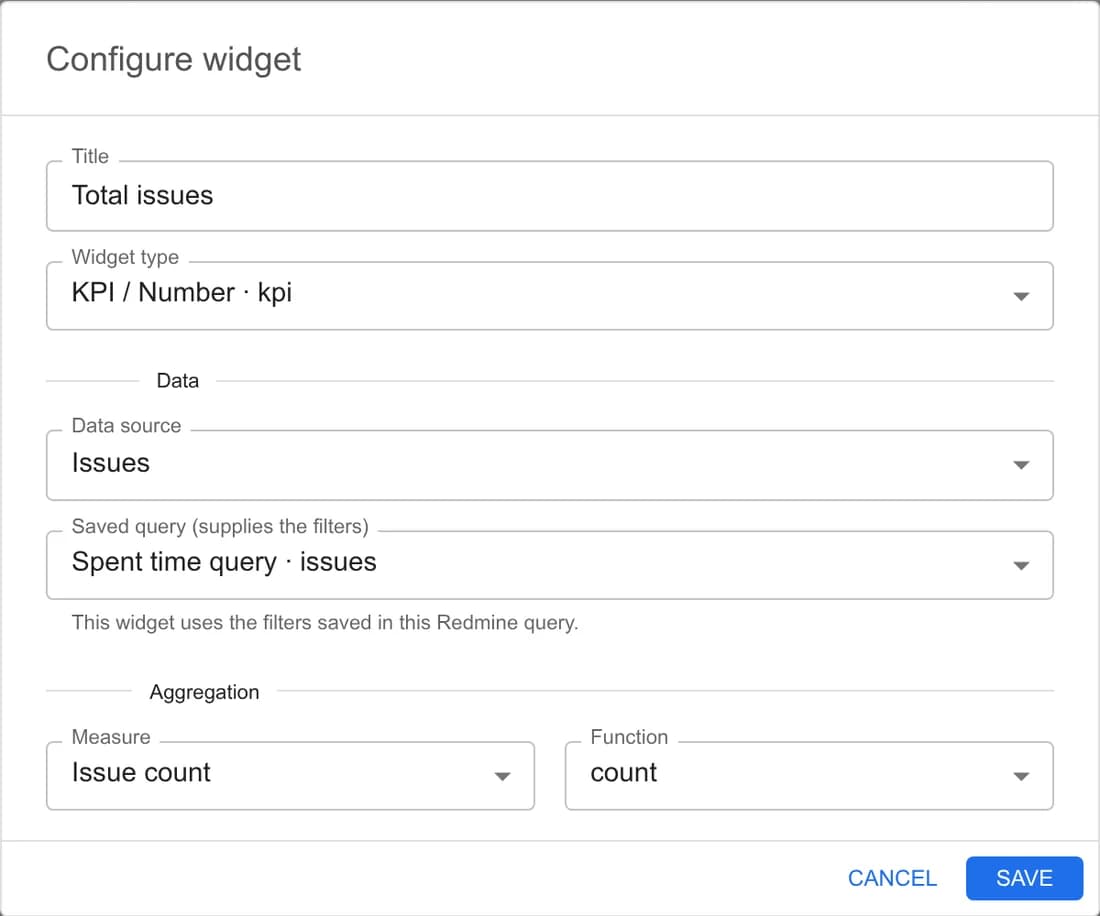
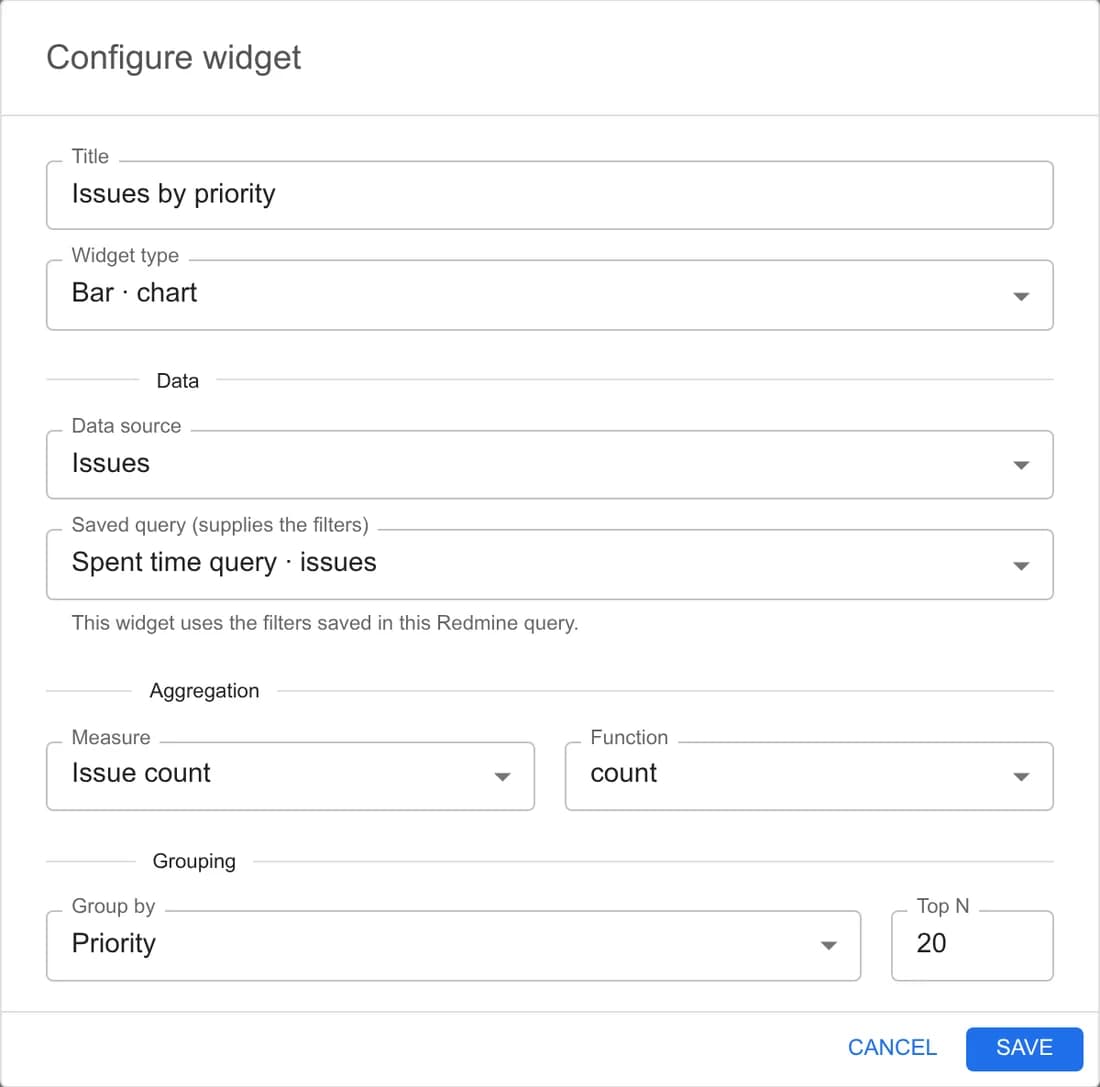
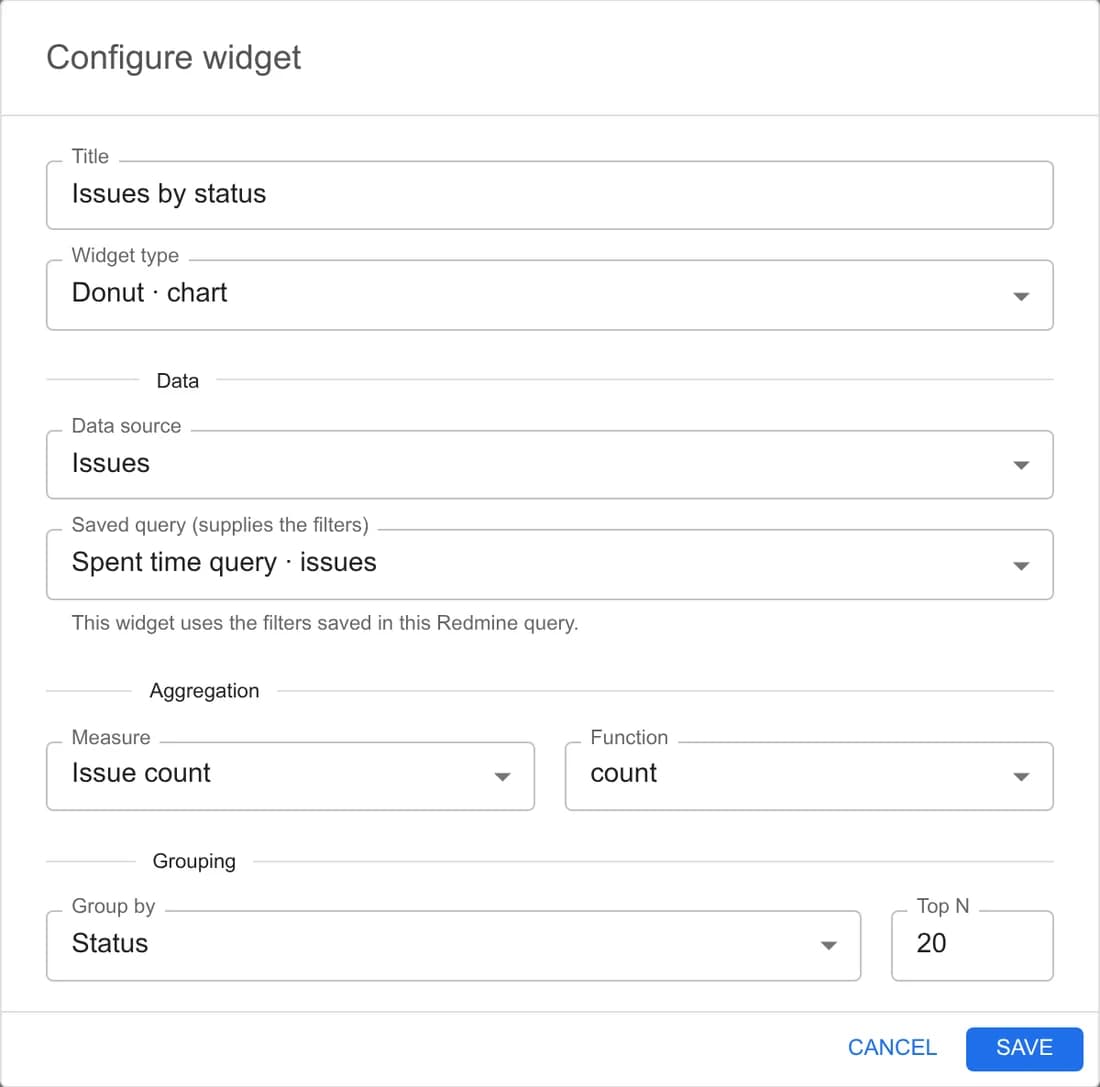
Every widget, whether it’s a KPI, a bar or a donut, is set up in the same short form: a title and a type, a data source, an optional saved query for filters, a measure, and a grouping with Top-N. Change the type and the form adapts.
One settings page for admins
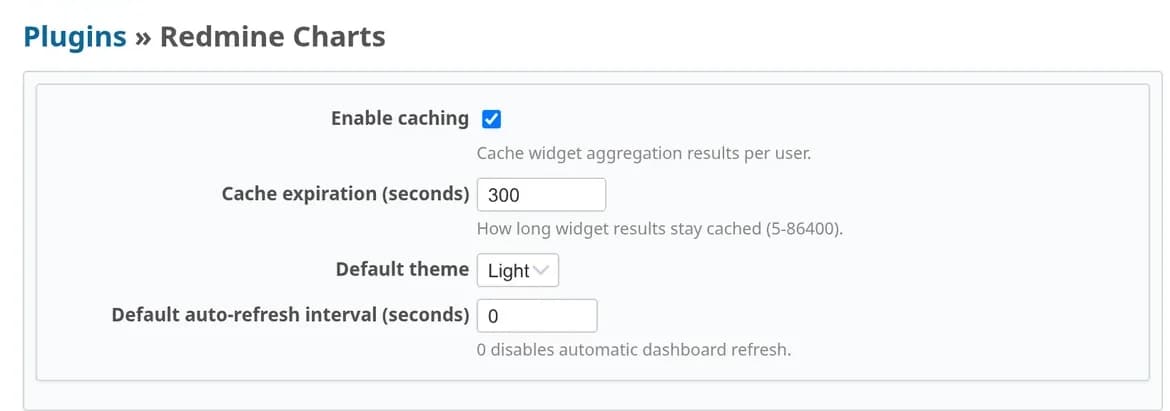
Under Administration › Plugins › Redmine Charts you set per-user result caching, the cache TTL (5–86400 seconds, default 300), the default light or dark theme, and a default auto-refresh interval, where 0 turns it off. The page is Redmine’s own plugin settings screen.
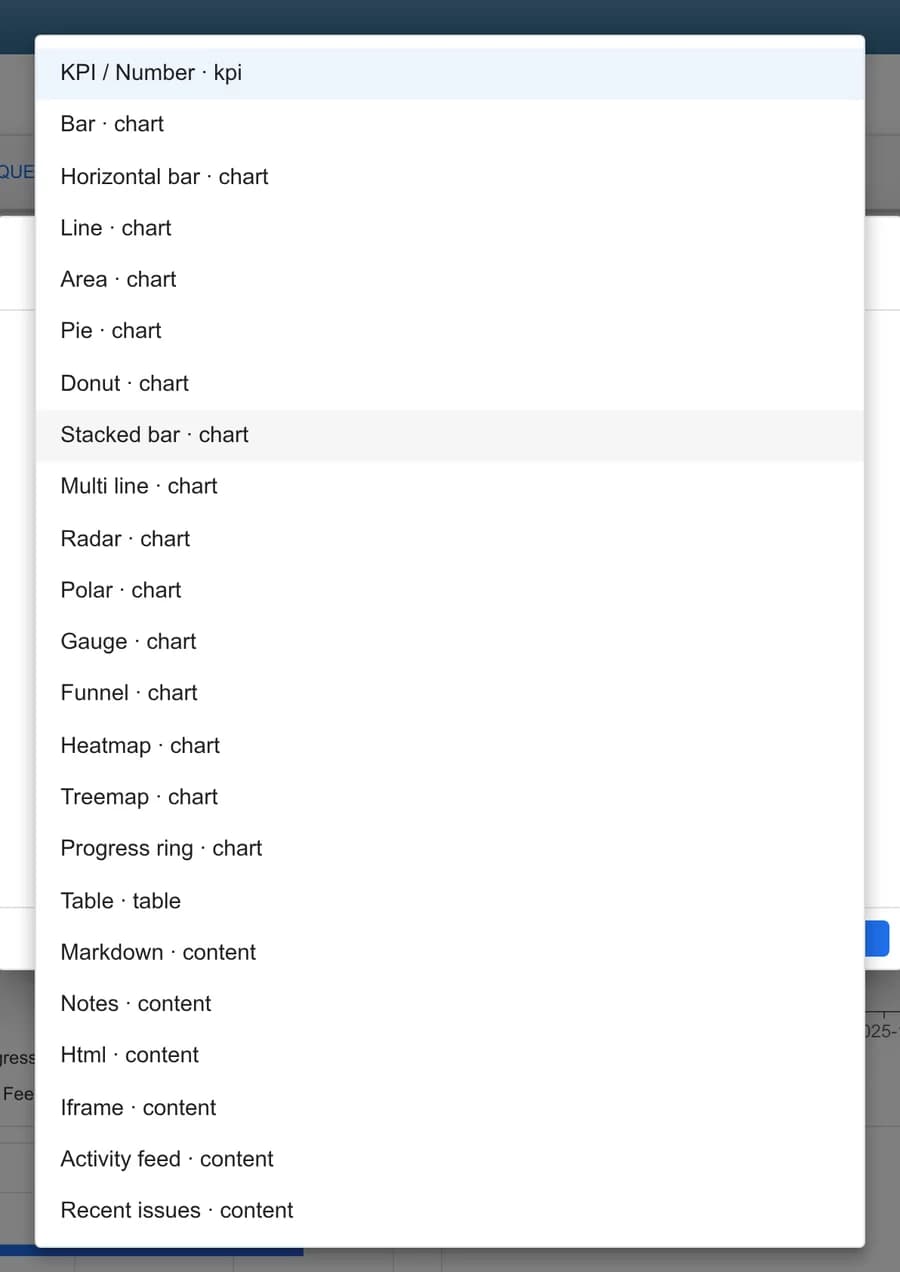
23 widget types, and room for yours
Every type is registry-driven metadata, so the configuration UI builds itself from the widget's own declaration rather than from a hand-written form per chart.
| Family | Types | Configured with |
|---|---|---|
| Charts | Bar, horizontal bar, stacked bar, line, multi-line, area, pie, donut, radar, polar, gauge, funnel, heatmap, treemap, progress ring | Source, dimension, measure, aggregation |
| KPI / number | A single aggregated figure with its own filter | count · sum · avg · min · max |
| Table | A paginated grid over the same permission-scoped data | Column picker and filters |
| Content | Markdown, notes, HTML, iframe, activity feed, recent issues | Free text, or one of Redmine's own feeds |
Drawn with Apache ECharts
Fifteen variants, themed for light and dark, redrawn on resize and still legible on a wall display. The bundle ships pre-built inside the package, so installing the plugin needs no Node and no build step.
Every segment drills down
Clicking a bar, a slice or a heatmap cell opens the Redmine issue list filtered to exactly those issues. The numbers stay auditable, because you can always land on the rows behind them.
Global filters and auto-refresh
One filter bar re-scopes every widget on the board at once, and a per-dashboard refresh interval keeps a screen in the corridor current. Zero turns refreshing off.
Templates and blueprints
Save a board as a reusable template, duplicate it per team, or export it as a JSON blueprint and import it into another instance — staging to production without rebuilding it by hand.
One plugin, a board for every team
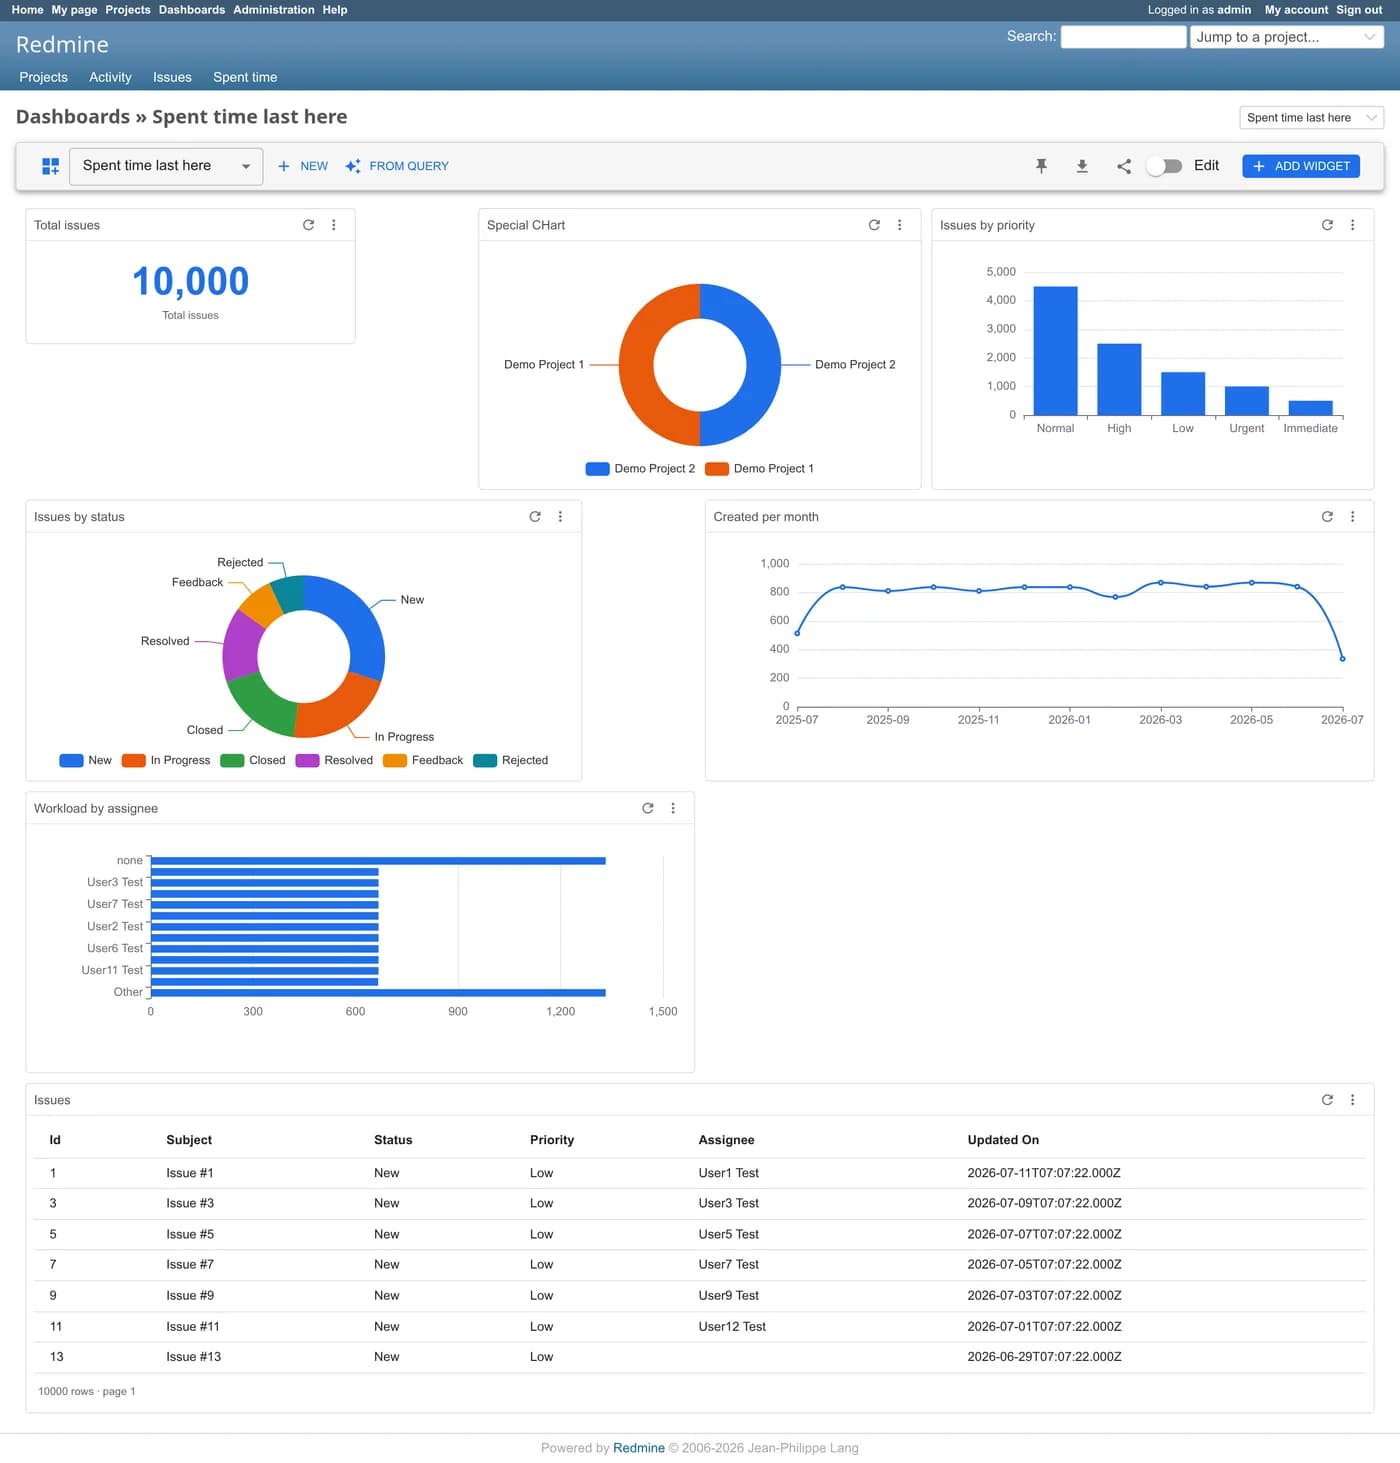
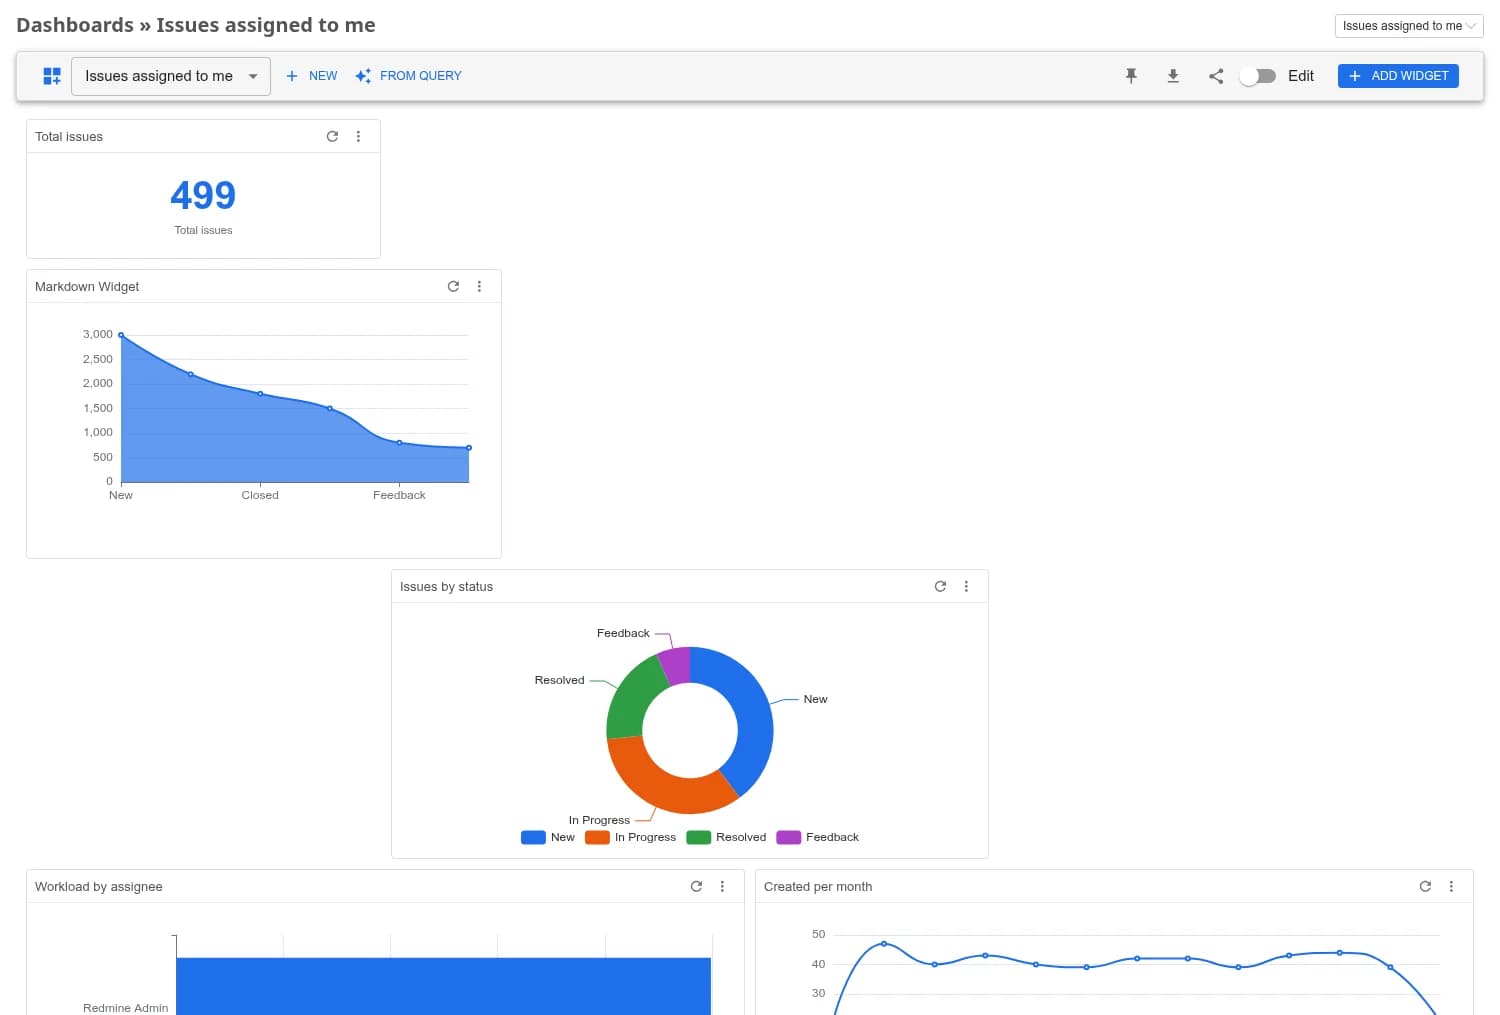
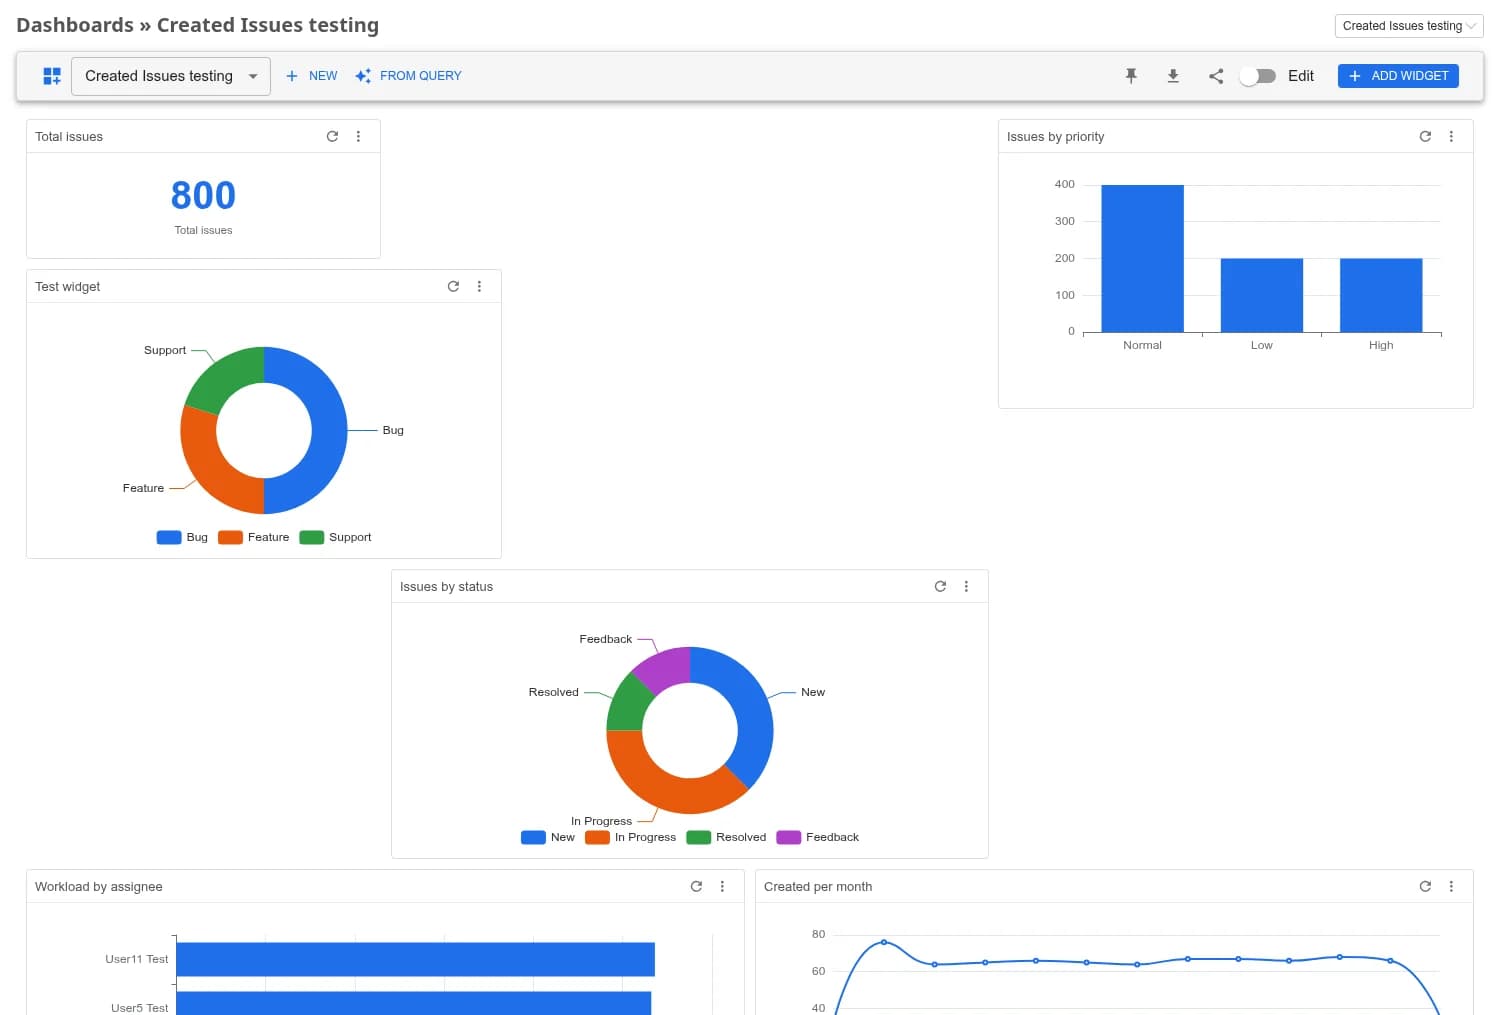
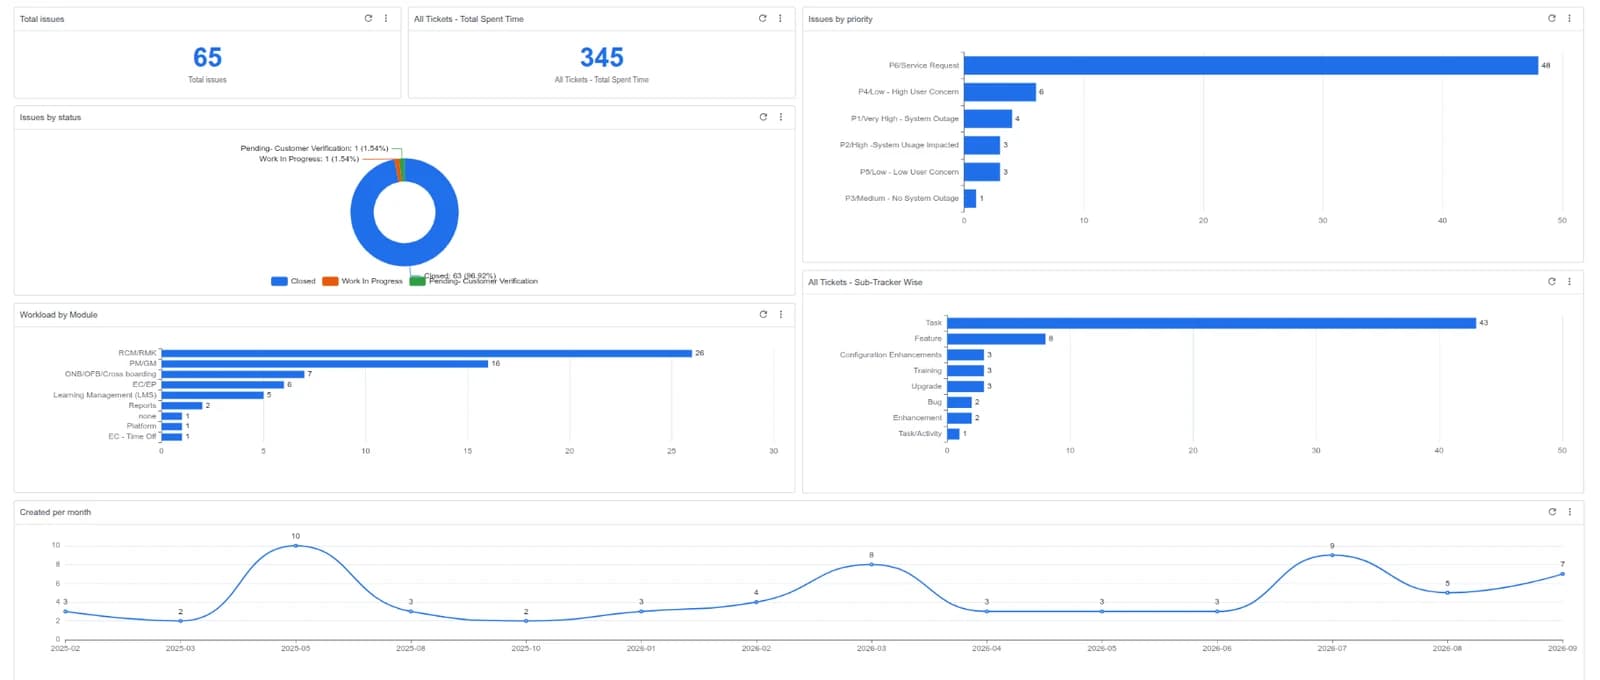
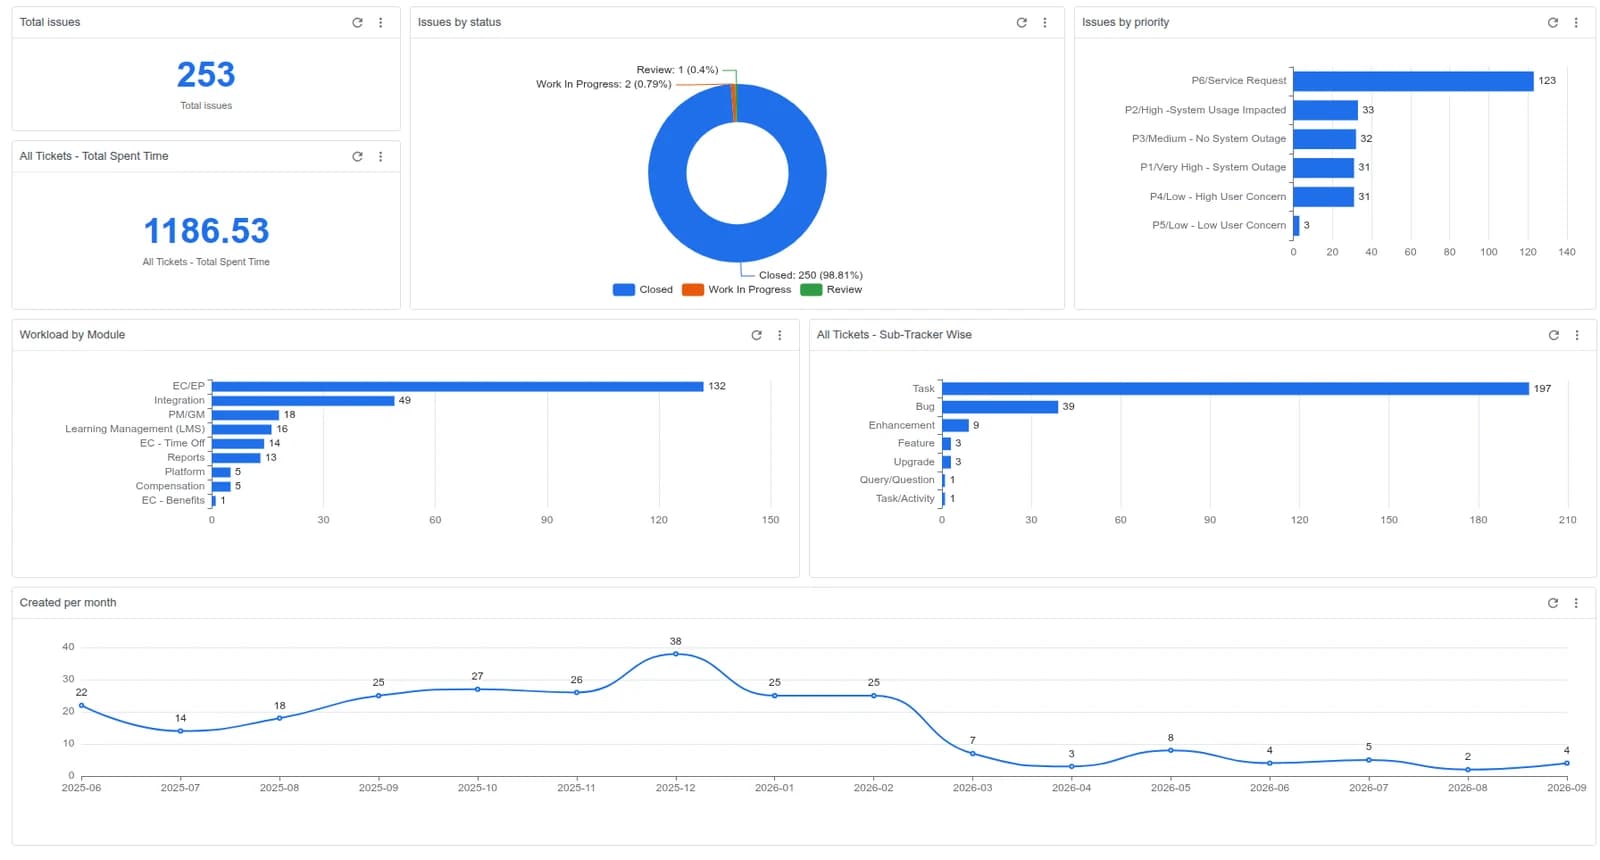
A delivery lead, a support desk and a single developer each built these in minutes from saved queries they already had.
Two sources built in, and yours beside them
Issues and time entries ship with their dimensions and measures registered up front, both behind Redmine's own visibility scopes. A source added by another plugin is treated identically.
| Source | Dimensions | Measures |
|---|---|---|
| Issues | Status, priority, tracker, project, assignee, author, category, version, created, updated, due date | Issue count, estimated hours, done ratio |
| Time entries | Project, user, activity, spent on | Hours, entry count |
| Your own | Whatever you register | Whatever you register |
Extending it is registration, not patching
A data source is a class with a name, its dimensions, its measures and a permission-scoped base_scope; a widget type is a hash. Register either one from your own plugin's init.rb with RedmineCharts.register_data_source or register_widget_type, and it appears in the configuration UI immediately — inheriting filtering, caching and drill-down. Nothing in this plugin is edited to make that work.
Nobody aggregates what they can't read
A dashboard is a fast way to leak a number, so every read starts from the viewer's own scope rather than ending with a check against it.
Visibility first, grouping second
Issue.visible(user), TimeEntry.visible(user) and Query.visible(user) constrain the relation before a single row is counted. A total from a project you are not a member of cannot appear in any widget, because those rows were never in the set.
Four granular permissions
View dashboards, create them, manage all of them, manage templates — each assignable per role. And all of it stays off until someone enables the Charts & Dashboards module for that project.
Sharing through memberships
Grant a board to users, groups, roles or whole projects. Every request re-resolves viewable_by? and editable_by? through Redmine's own memberships, rather than through a parallel access list that drifts out of step.
Nothing leaves the server
The frontend talks only to this plugin's JSON API on your own Redmine, over the session and CSRF token that are already there. No external service, no licence phone-home, no telemetry.
Built to survive a big instance
Counting a hundred thousand issues should not mean loading a hundred thousand objects. Here it doesn't.
| Concern | How it is handled |
|---|---|
| Aggregation | GROUP BY, COUNT, SUM and AVG run in SQL — rows are never instantiated just to be counted |
| Wide dimensions | Top-N folding keeps the payload small when a dimension has thousands of values |
| Repeat views | Results cached per user, widget mtime and active filters through Rails.cache; the TTL is a setting and Redis works as-is |
| One slow widget | Widgets load independently, so a single heavy query never holds the whole board hostage |
| A missing JS bundle | Rails renders every widget's data server-side as a fallback, so the page degrades instead of going blank |
Deliberately portable, not accidentally
Cross-version and cross-database support is designed in — migrations, JSON storage and date bucketing were all written to survive the differences.
| Concern | Supported | How |
|---|---|---|
| Redmine | 4.x, 5.x, 6.x, 7.x | Declares requires_redmine version_or_higher 4.0.0, with no core overrides to drift out of date |
| Rails | 5.2 → 8.0 | Migrations target the 5.2 baseline that every release up to 8.0 understands |
| Ruby | 2.5+ | Matches the minimum Redmine 4 requirement |
| Databases | MySQL, MariaDB, PostgreSQL | JSON lives in plain text columns — identical DDL everywhere — with a serializer that picks the right form per Rails version |
| Date grouping | Day, week, month, year | Groups on a portable CAST(col AS DATE), then folds into buckets in Ruby — no vendor-specific SQL |
| Re-running migrations | Safe | Written defensively, so an interrupted upgrade can be replayed |
Scriptable from the first day
Every endpoint lives under /redmine_charts/api, returns JSON and enforces exactly the permissions the UI does — so boards can be provisioned from CI or generated one per team.
| Method | Path | What it does |
|---|---|---|
| GET | /dashboards | Every dashboard visible to the caller |
| POST | /dashboards | Create one |
| GET | /dashboards/:id | Fetch a dashboard with its widgets |
| PATCH | /dashboards/:id | Update name, layout or settings |
| POST | /dashboards/:id/duplicate | Clone it, widgets included |
| GET | /dashboards/:id/export | Export a JSON blueprint |
| POST | /dashboards/import | Create a board from a blueprint |
| POST | /dashboards/:id/widgets | Add a widget |
| GET | /widgets/:id/data | Aggregated, permission-scoped widget data |
| GET | /meta/data_sources | Sources, dimensions, measures and the saved queries you can use |
What ships today, and what’s next
The roadmap items are additive by design — new data sources, widget types and export services — so none of them will ask you to migrate anything. They’re listed as roadmap, not as features, so you can buy on what’s in the box today.
| Capability | Status |
|---|---|
| Dashboards: create, duplicate, set default, export and import | Live |
| Drag-and-drop resizable grid with auto-save | Live |
| KPI, table and the full ECharts chart set | Live |
| Visual no-SQL widget configuration | Live |
| Saved-query reuse and one-click board generation | Live |
| Global filters that refresh the whole board | Live |
| Chart → issue-list drill-down | Live |
| Per-user, permission-scoped SQL aggregation and caching | Live |
| Sharing, templates, light and dark themes | Live |
| Cross-version, cross-database, server-side fallback | Live |
| PDF, PNG and Excel export | Planned |
| Background jobs for very heavy reports | Planned |
| WebSocket live updates | Planned |
| Scheduled and emailed snapshots | Planned |
| Kiosk / wallboard mode | Planned |
| AI natural-language report builder | Planned |
| Calendar, burndown and gantt-summary widgets | Planned |
Install in three steps
Requires shell access and the ability to run rake tasks. Always back up before installing a plugin.
cd /path/to/redmine
# unzip the package from your email or download link
unzip redmine_charts-1.0.0.zip -d plugins/
bundle install
bundle exec rake redmine:plugins:migrate NAME=redmine_charts RAILS_ENV=production
# optional: the built-in dashboard templates
bundle exec rake redmine_charts:seed_templates RAILS_ENV=production
touch tmp/restart.txt
# Project → Settings → Modules → Charts & Dashboards
# then grant the dashboard permissions to the roles that need them
# a Dashboards entry appears in the top menu for anyone who holds one
Does it patch or override any Redmine core files?
Do I need Node.js or a build step to install it?
Will my existing saved queries work, including the complicated ones?
Can someone see numbers from a project they have no access to?
Which databases are supported?
Which Redmine and Rails versions does it run on?
Can we add our own data sources or chart types?
What is deliberately not in version 1.0?
Pricing
Single server
One Redmine instance · unlimited users · 12 months of updates.
Multiple servers
Unlimited Redmine servers · unlimited users · 12 months of updates.